Creating Metrics Dashboards in Grafana
After you’ve integrated your Thriftly APIs with Prometheus (as described in the Analyzing Metrics Using Prometheus section), you can create comprehensive, visually-pleasing metrics dashboards by importing your Prometheus metrics into Grafana.
To create dashboards in Grafana, you must:
Install, configure, and launch Grafana.
Import your Prometheus metrics into Grafana.
Create a Grafana dashboard to show API metrics.
Installing and Launching Grafana
Download Grafana from the company’s website.
Navigate to your downloads folder and extract the files from the grafana-version.number.windows-x64.zip folder.
After the grafana-version.number.windows-x64 folder appears, follow the path
grafana-version.number.windows-x64\grafana-version.number\conf.In the conf folder, copy the sample.ini file. Name your copy custom.ini.
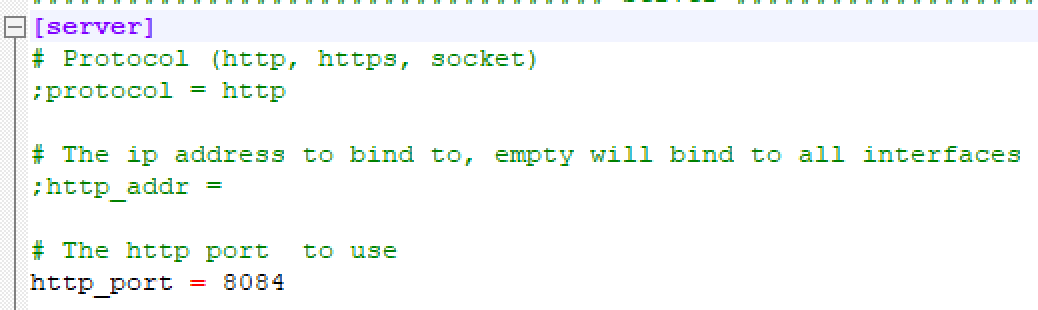
Open custom.ini (using Notepad ++ or your text editor of choice). Then, use CTRL + F to search for http_port.
Remove the semi-colon that appears at the beginning of the line containing http_port. Then, set the local port on which you want to use Grafana.
From the conf folder, navigate back to the grafana-version.number folder. Then, go to the bin folder.
Right-click grafana-server and run the program as an administrator. A command line window should appear to confirm the application is running.
Right-click grafana-cli to run the program as an administrator.
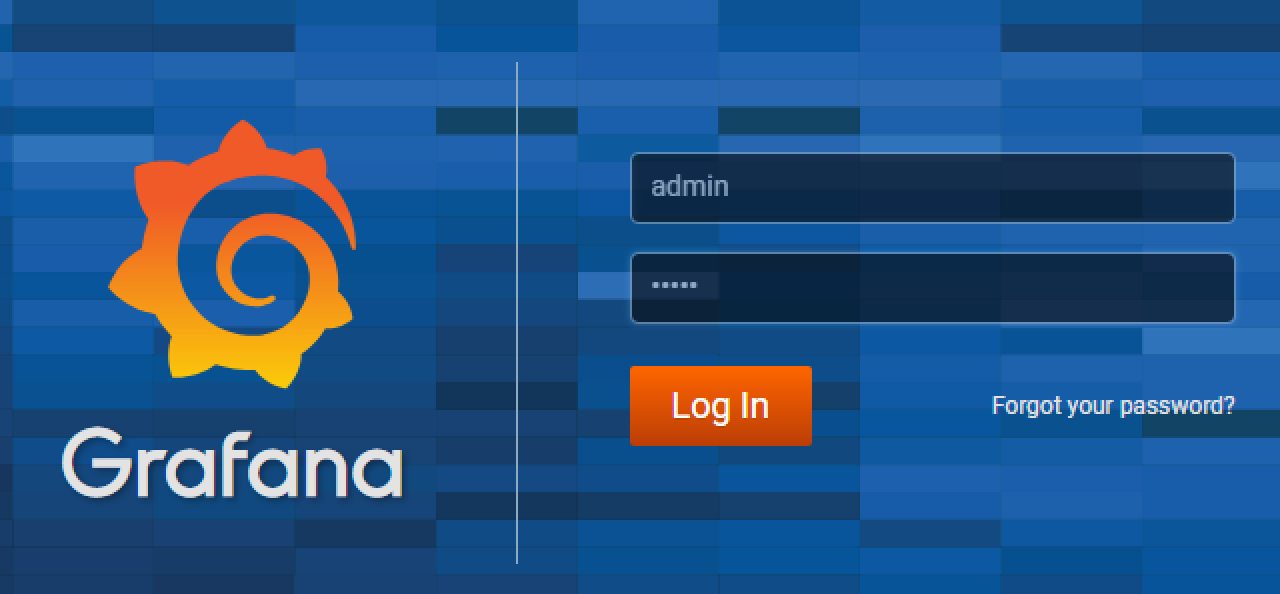
Open your web browser and navigate to the localhost port you specified in step 6. The Grafana login page should appear. Enter both a username and password of admin to log in.
You’ve now successfully installed and launched Grafana. Next, we’ll walk you through importing your Prometheus metrics into Grafana.
Importing Prometheus Metrics into Grafana
From the Grafana sidebar, select Configuration > Data Sources.

When the Configuration page appears, select Add data source. The Data Sources page appears.
On the Data Sources page:
In the Name field, enter a name for this data source (such as Prometheus).
Select the Default checkbox to make Prometheus your default data source.
In the Type field, select Prometheus.
In the URL field, enter the localhost port on which you’ve configured Prometheus to operate. If you’re using our default configuration, you should enter http://localhost:9090.
Adjust any of the other, optional settings on this page as you desire. Then, scroll down and select Save & Test. A message should appear to confirm you added a data source.
You’ve now connected Prometheus to Grafana, which means you can begin monitoring your Thriftly API using Grafana’s comprehensive graphing and analysis tools. Below, we’ll walk you through creating a very simple Grafana dashboard that contains one graph element and one table element. Then, we’ll provide some resources to help you create your own robust API metrics dashboards.
Creating a Grafana Dashboard
From the Grafana sidebar, select Dashboards > Manage.

From the Dashboards page, select the +Dashboard button to create a new dashboard.
Before we start adding elements to this dashboard, let’s give our dashboard a name. Select the Settings button found in the upper right-hand corner of the dashboard.
The General form appears:
In the Name field, enter a name for your dashboard (such as Thriftly API Monitoring).
In the Description field, enter a description for your dashboard.
Select the Save button. When the Save changes window appears, enter a description of the changes you made and then select Save.
You’re returned to your dashboard. Now, select the Add panel button.
When the options for what type of panel to add appear, select Graph.
A new graph element appears in your dashboard. To edit this graph, select Panel Title from the top of the graph, and then select Edit.
The graph element appears full-screen within your web browser. In the following example, we’re going to create a graph that shows the total amount of data sent to and from your API within a certain time period, which is an important metric you’ll likely want to monitor.
Creating a Grafana Graph
Within the graph configuration screen, select the General tab.
In the Title field, enter a title for your graph, such as Request and Response Data Total.
In the Description field, enter a description such as “This graph shows the amount of data sent to and from our APIs.”
Select the Metrics tab.
In the Data Source field, select Prometheus (or whatever you named the data source you added above).
In the A, B, etc. fields, enter the metrics you want to show on this graph:
In the A field, enter the thriftly_runtime_request_bytes_total metric. Then, in the Legend format field, enter Total Bytes Requested.
Select the Add Query button that appears next to the B button. Then, in the field that appears, enter the thriftly_runtime_response_bytes_total metric. In the Legend format field, enter Total Bytes Responded.
Optionally, to combine multiple calls into one metric, you can use the sum() function,
sum(thriftly_runtime_request_bytes_total)andsum(thriftly_runtime_response_bytes_total).
Select the Save button that appears in the upper right-hand side of the dashboard. Then, select the Back to Dashboard button to return to your dashboard and view your graph.
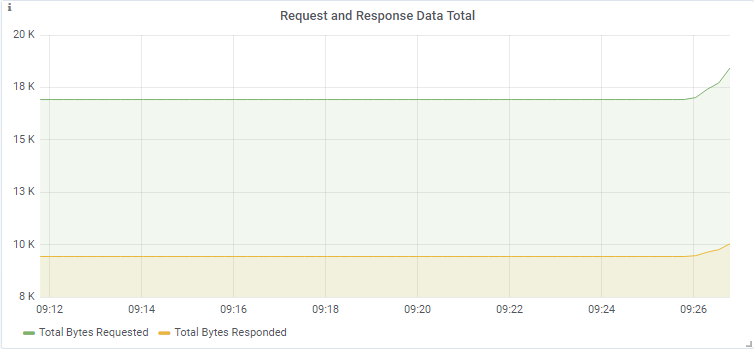
You’ve now added a basic graph to your dashboard. In the next section, we’ll add a basic table.
Creating a Grafana Table
From the upper right-hand side of the dashboard, select the Add panel button.
When the options for what type of panel to add appear, select Table.
A new table element appears in your dashboard. To edit this table, select Panel Title from the table, and then select Edit.
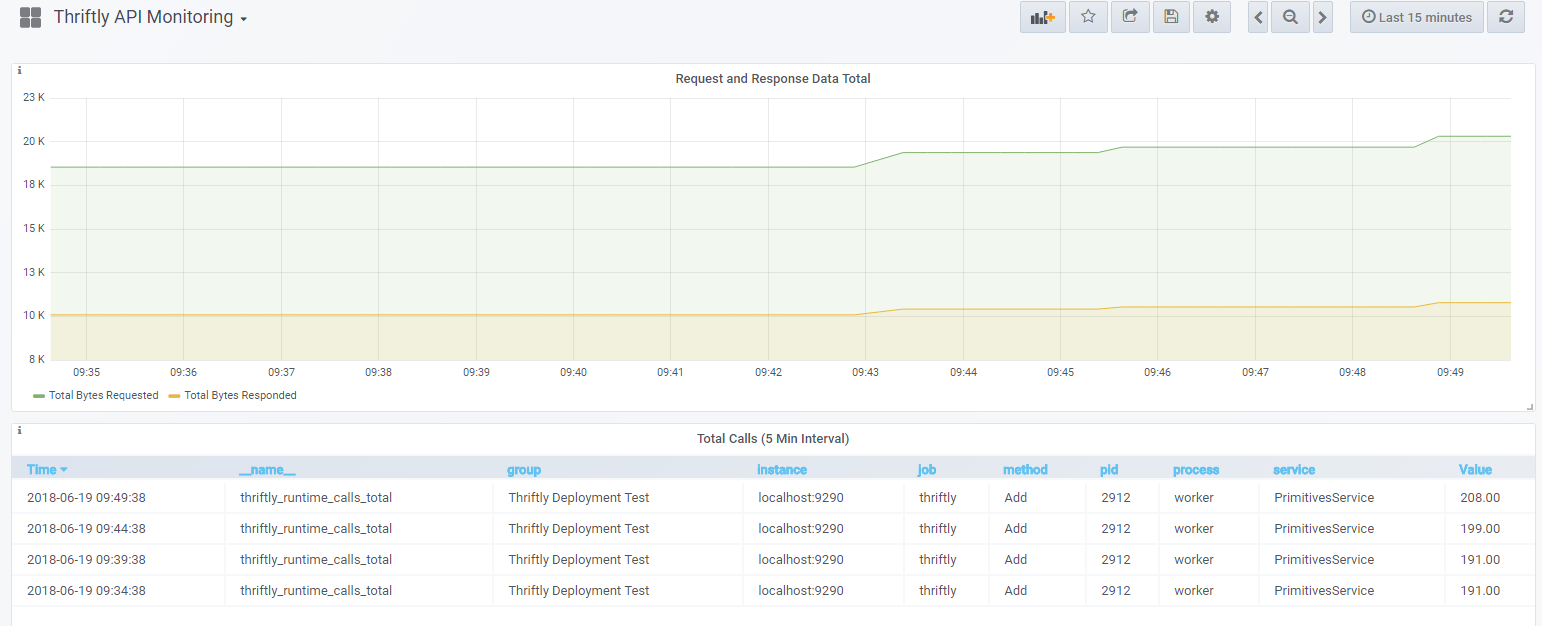
The table element appears full-screen within your web browser. In the following example, we’re going to create a table that shows the total number of calls made to your API, broken out into five minute intervals:
Within the table configuration screen, select the General tab.
In the Title field, enter a title for your table, such as Total Calls (5 Min Interval).
In the Description field, enter a description such as “Shows the total number of API calls, broken out into five minute intervals”.
Select the Metrics tab.
In the Data Source field, select Prometheus (or whatever you named your data source).
In the A field, enter the thriftly_runtime_calls_total metric.
In the Min Step field, enter 5m.
Select the Save button that appears in the upper right-hand side of the dashboard. Then, select the Back to Dashboard button to return to your dashboard.
Now you can see the total number of calls made to your API and trace that number backward through five minute intervals, to see the amount of traffic your API received within any given five minute time period.
Of course, there’s a lot more you can do with Grafana, including combining metrics queries and creating additional types of dashboard elements. To learn more, click over to Grafana’s own documentation on creating and managing dashboards.
After you’ve learned all you need to know and configured your dashboard how you like it, read on for a simple example of creating and receiving metrics-based alerts using Grafana, in the Creating Grafana Email Alerts section.